Preclinical AIF#
Show code cell source
import os
import numpy
from matplotlib import pyplot as plt
from matplotlib.transforms import offset_copy
import csv
import seaborn as sns
import pandas as pd
import json
from pathlib import Path
Background#
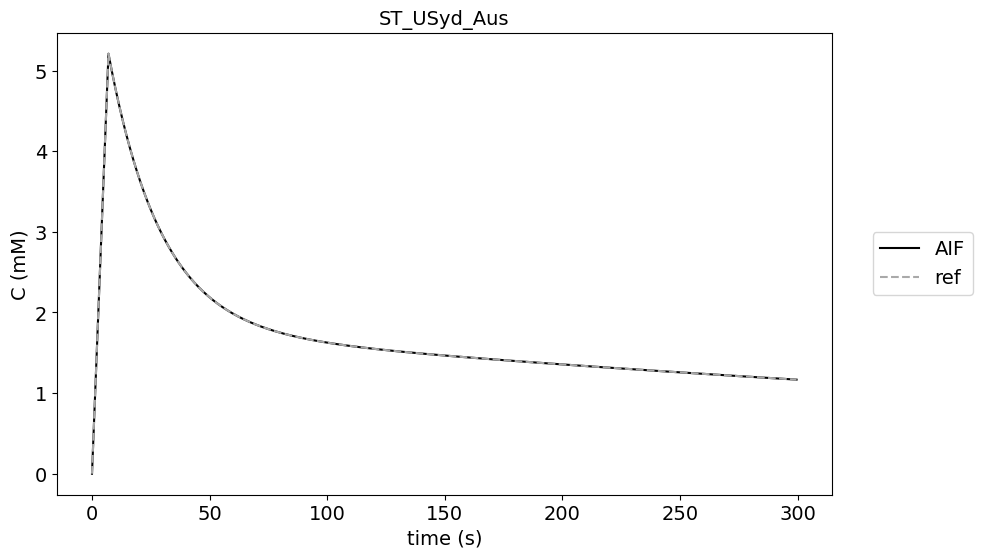
This preclinical AIF is derived from DCE-MRI data of rats described in the the paper of McGrath et al. (MRM 2009).
Test data#
To create the AIF the parameters of the functional form are copied from Table 1, Model B of the reference. The original data had a temp resolution of 0.5 s and tot acquisition time of 300s. This data was labeled as ‘Original_AIF’. Permutations of this AIF were used to test the implementations:
various temporal resolutions: 0.5, 1, 2, 2.5, 5, 7.5 s
various acquistion times: 3, 5, 7, 10 min
shifts of the AIF with a temporal resolution of 1.5 s (dt): 0, dt, 2dt, 5dt, 2, 5, 10, 18, 31
As we don’t expect many errors in implementing the population AIFs, the tolerances were set tight.
Tolerances: absolute + relative = 0.0001 mM + 0.01 and 0.1 mM + 0.1 for the data with a shift.
Import data#
# Load the meta data
meta = json.load(open("../test/results-meta.json"))
# Loop over each entry and collect the dataframe
df = []
for entry in meta:
    if (entry['category'] == 'PopulationAIF') & (entry['method'] == 'preclinical') :
        fpath, fname, category, method, author = entry.values()
        df_entry = pd.read_csv(Path(fpath, fname)).assign(author=author)
        df.append(df_entry)

# Concat all entries
df = pd.concat(df)
# label data source
df['source']=''
df.loc[df['label'].str.contains('original'),'source']='original'
df.loc[df['label'].str.contains('acq_time_'),'source']='acq_time'
df.loc[df['label'].str.contains('temp_res'),'source']='temp_res'
df.loc[df['label'].str.contains('delay'),'source']='delay'

author_list = df.author.unique()
no_authors = len(author_list)
Results#
Original AIF#
data_original = df[(df['source']=='original')]

fig, axs = plt.subplots(1, no_authors, sharey='none',figsize=(10,6))

for current_author in range(no_authors):
    plt.subplot(1,no_authors,current_author+1)
    subset_data = data_original[data_original['author'] == author_list[current_author]]
    plt.plot(subset_data.time_ref, subset_data.cb_measured, color='black',label ="AIF")
    plt.plot(subset_data.time_ref, subset_data.aif_ref, color='darkgrey', linestyle='dashed', label='ref')

    plt.title(author_list[current_author], fontsize=14)
    plt.xlabel('time (s)', fontsize=14)
    plt.ylabel('C (mM)', fontsize=14)
    plt.xticks(fontsize=14)
    plt.yticks(fontsize=14)
    plt.legend(bbox_to_anchor=(1.04,0.5), loc="center left", fontsize=14)
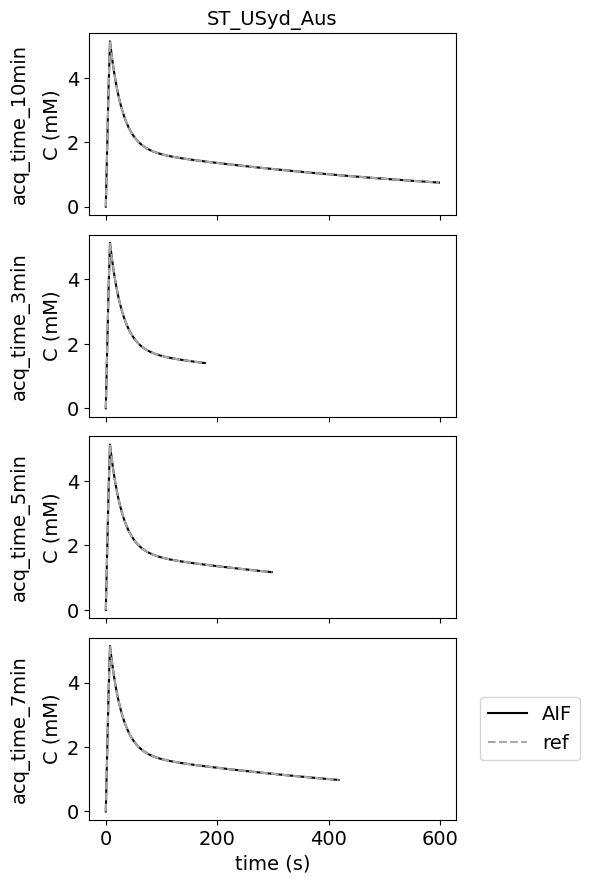
Different acquisition times#
There are no errors for different acquisition times.
This test data was added to check whether the contributions can work with acquisition times different from the original reference.
data_acqtime = df[(df['source']=='acq_time')]
acq_list = data_acqtime.label.unique()
no_acq = len(acq_list)

fig, ax = plt.subplots(no_acq, no_authors, sharex='col', sharey='row', figsize=(6,9))

if no_authors > 1:
    for current_acq in range(no_acq):
        for current_author in range(no_authors):
            subset_data = data_acqtime[(data_acqtime['author'] == author_list[current_author]) & (data_acqtime['label'] == acq_list[current_acq])]
            ax[current_acq,current_author].plot(subset_data.time_ref, subset_data.cb_measured, color='black',label ="AIF")
            ax[current_acq,current_author].plot(subset_data.time_ref, subset_data.aif_ref, color='darkgrey', linestyle='dashed', label='ref')

            if current_acq == 0:
                ax[current_acq,current_author].set_title(author_list[current_author], fontsize=14)
            if current_author == 0:
                ax[current_acq,current_author].set_ylabel('C (mM)', fontsize=14)
            if current_acq == no_acq-1:
                ax[current_acq,current_author].set_xlabel('time (s)', fontsize=14)
            ax[current_acq,current_author].tick_params(axis='x', labelsize=12)
            ax[current_acq,current_author].tick_params(axis='y', labelsize=12)

    ax[no_acq-1,no_authors-1].legend(bbox_to_anchor=(1.04,0.5), loc="center left", fontsize=14)

    # add extra labels for rows (example taken from: https://microeducate.tech/row-and-column-headers-in-matplotlibs-subplots/)
    pad = 5
    for a, row in zip(ax[:,0], acq_list):
        a.annotate(row, xy=(0, 0.5), xytext=(-a.yaxis.labelpad - pad, 0),
                    xycoords=a.yaxis.label, textcoords='offset points',
                    ha='right', va='center', rotation=90, fontsize=14)


else:
    for current_acq in range(no_acq):
        subset_data = data_acqtime[(data_acqtime['author'] == author_list[current_author]) & (data_acqtime['label'] == acq_list[current_acq])]
        ax[current_acq].plot(subset_data.time_ref, subset_data.cb_measured, color='black',label ="AIF")
        ax[current_acq].plot(subset_data.time_ref, subset_data.aif_ref, color='darkgrey', linestyle='dashed', label='ref')
        ax[current_acq].set_ylabel('C (mM)', fontsize=14)

        if current_acq == 0:
            ax[current_acq].set_title(author_list[current_author], fontsize=14)
        if current_acq == no_acq-1:
            ax[current_acq].set_xlabel('time (s)', fontsize=14)
        ax[current_acq].tick_params(axis='x', labelsize=14)
        ax[current_acq].tick_params(axis='y', labelsize=14)

    ax[no_acq-1].legend(bbox_to_anchor=(1.04,0.5), loc="center left", fontsize=14)
    #add extra labels for rows
    pad = 5
    for a, row in zip(ax, acq_list):
        a.annotate(row, xy=(0, 0.5), xytext=(-a.yaxis.labelpad - pad, 0),
                xycoords=a.yaxis.label, textcoords='offset points',
                ha='right', va='center', rotation=90, fontsize=14)


fig.tight_layout()
fig.subplots_adjust(left=0.15, top=0.95)
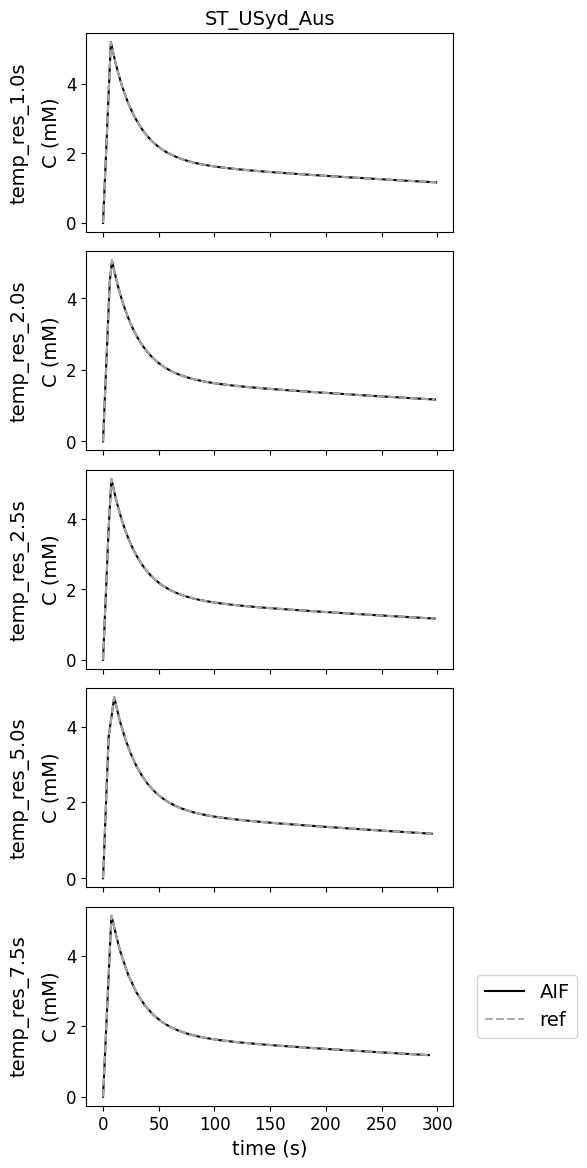
Different temporal resolutions#
There are no errors for various temporal resolutions
This test data was added to check whether the contributions can work with temporal resolutions different from the original reference.
data_res = df[(df['source']=='temp_res')]
res_list = data_res.label.unique()
no_res = len(res_list)

fig, ax = plt.subplots(no_res, no_authors, sharex='col', sharey='row', figsize=(6,12))

if no_authors > 1:
    for current_res in range(no_res):
        for current_author in range(no_authors):
            subset_data = data_res[(data_res['author'] == author_list[current_author]) & (data_res['label'] == res_list[current_res])]
            ax[current_res,current_author].plot(subset_data.time_ref, subset_data.cb_measured, color='black',label ="AIF")
            ax[current_res,current_author].plot(subset_data.time_ref, subset_data.aif_ref, color='darkgrey', linestyle='dashed', label='ref')

            if current_res == 0:
                ax[current_res,current_author].set_title(author_list[current_author], fontsize=14)
            if current_author == 0:
                ax[current_res,current_author].set_ylabel('C (mM)', fontsize=14)
            if current_res == no_res-1:
                ax[current_res,current_author].set_xlabel('time (s)', fontsize=14)
            ax[current_res,current_author].tick_params(axis='x', labelsize=12)
            ax[current_res,current_author].tick_params(axis='y', labelsize=12)

    ax[no_res-1,no_authors-1].legend(bbox_to_anchor=(1.04,0.5), loc="center left", fontsize=14)

    #add extra labels for rows
    pad = 5
    for a, row in zip(ax[:,0], res_list):
        a.annotate(row, xy=(0, 0.5), xytext=(-a.yaxis.labelpad - pad, 0),
                    xycoords=a.yaxis.label, textcoords='offset points',
                    ha='right', va='center', rotation=90, fontsize=14)

else:
    for current_res in range(no_res):
        subset_data = data_res[(data_res['author'] == author_list[current_author]) & (data_res['label'] == res_list[current_res])]
        ax[current_res].plot(subset_data.time_ref, subset_data.cb_measured, color='black',label ="AIF")
        ax[current_res].plot(subset_data.time_ref, subset_data.aif_ref, color='darkgrey', linestyle='dashed', label='ref')
        ax[current_res].set_ylabel('C (mM)', fontsize=14)

        if current_res == 0:
            ax[current_res].set_title(author_list[current_author], fontsize=14)
        if current_res == no_res-1:
            ax[current_res].set_xlabel('time (s)', fontsize=14)
        ax[current_res].tick_params(axis='x', labelsize=12)
        ax[current_res].tick_params(axis='y', labelsize=12)

    #add extra labels for rows
    pad = 5
    for a, row in zip(ax, res_list):
        a.annotate(row, xy=(0, 0.5), xytext=(-a.yaxis.labelpad - pad, 0),
                    xycoords=a.yaxis.label, textcoords='offset points',
                    ha='right', va='center', rotation=90, fontsize=14)

    ax[no_res-1].legend(bbox_to_anchor=(1.04,0.5), loc="center left", fontsize=14)

fig.tight_layout()
fig.subplots_adjust(left=0.15, top=0.95)
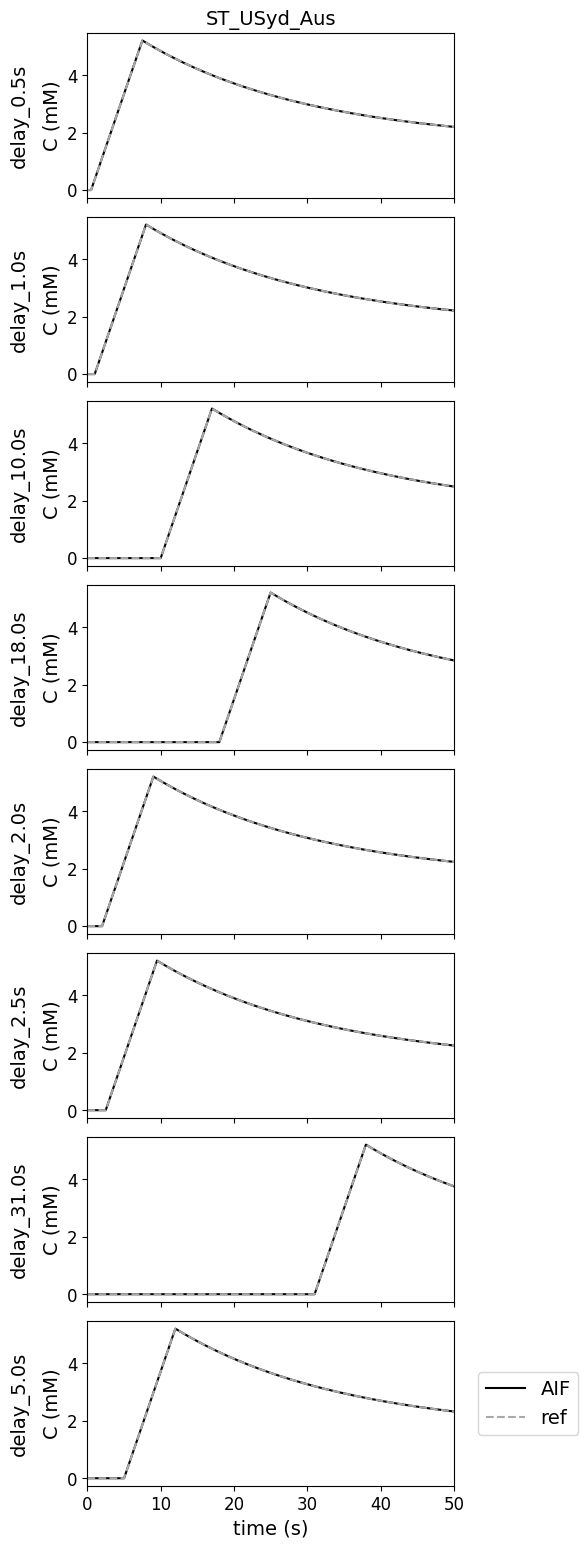
Variations in bolus arrival time#
This test data was added to check how contributions deal with a difference in bolus arrival time. Figures are zoomed on the first 50 s to show the differences in the peak due to differences in bolus arrival time. In this case there was no difference between reference and measured AIFs.
data_delay = df[(df['source']=='delay')]
delay_list = data_delay.label.unique()
no_delay = len(delay_list)

fig, ax = plt.subplots(no_delay, no_authors, sharex='col', sharey='row', figsize=(6,16))

if no_authors > 1:
    for current_delay in range(no_delay):
        for current_author in range(no_authors):
            subset_data = data_delay[(data_delay['author'] == author_list[current_author]) & (data_delay['label'] == delay_list[current_delay])]
            ax[current_delay,current_author].plot(subset_data.time_ref, subset_data.cb_measured, color='black',label ="AIF")
            ax[current_delay,current_author].plot(subset_data.time_ref, subset_data.aif_ref, color='darkgrey', linestyle='dashed', label='ref')

            if current_delay == 0:
                ax[current_delay,current_author].set_title(author_list[current_author], fontsize=14)
            if current_author == 0:
                ax[current_delay,current_author].set_ylabel('C (mM)', fontsize=14)
            if current_delay == no_res-1:
                ax[current_delay,current_author].set_xlabel('time (s)', fontsize=14)

            ax[current_delay,current_author].set_xlim([0, 50])
            ax[current_delay,current_author].tick_params(axis='x', labelsize=12)
            ax[current_delay,current_author].tick_params(axis='y', labelsize=12)

    ax[no_delay-1,no_authors-1].legend(bbox_to_anchor=(1.04,0.5), loc="center left", fontsize=14)

    # add extra labels for rows
    pad = 5
    for a, row in zip(ax[:,0], delay_list):
        a.annotate(row, xy=(0, 0.5), xytext=(-a.yaxis.labelpad - pad, 0),
                    xycoords=a.yaxis.label, textcoords='offset points',
                    ha='right', va='center', rotation=90, fontsize=14)

else:
    for current_delay in range(no_delay):
        subset_data = data_delay[(data_delay['author'] == author_list[current_author]) & (data_delay['label'] == delay_list[current_delay])]
        ax[current_delay].plot(subset_data.time_ref, subset_data.cb_measured, color='black',label ="AIF")
        ax[current_delay].plot(subset_data.time_ref, subset_data.aif_ref, color='darkgrey', linestyle='dashed', label='ref')
        ax[current_delay].set_ylabel('C (mM)', fontsize=14)

        if current_delay == 0:
            ax[current_delay].set_title(author_list[current_author], fontsize=14)
        if current_delay == no_delay-1:
            ax[current_delay].set_xlabel('time (s)', fontsize=14)
        ax[current_delay].tick_params(axis='x', labelsize=12)
        ax[current_delay].tick_params(axis='y', labelsize=12)

        ax[current_delay].set_xlim([0, 50])

    #add extra labels for rows
    pad = 5
    for a, row in zip(ax, delay_list):
        a.annotate(row, xy=(0, 0.5), xytext=(-a.yaxis.labelpad - pad, 0),
                    xycoords=a.yaxis.label, textcoords='offset points',
                    ha='right', va='center', rotation=90, fontsize=14)

    ax[no_delay-1].legend(bbox_to_anchor=(1.04,0.5), loc="center left", fontsize=14)

fig.tight_layout()
fig.subplots_adjust(left=0.15, top=0.95)
Notes#
Additional notes/remarks
References#
McGrath et al. “Comparison of Model-Based Arterial Input Functions forDynamic Contrast-Enhanced MRI in Tumor Bearing Rats”, Magn Reson Med (2009), DOI: 10.1002/mrm.21959